excel interpolate
Excel interpolation is a powerful technique used in data analysis to estimate values that fall between known data points. Whether you’re working with financial data, scientific measurements, or market trends, understanding how to interpolate in Excel can enhance your analytical capabilities and provide valuable insights. In this guide, we’ll explore what Excel interpolation is, how it works, and practical examples of its applications.
Excel interpolate
Interpolation in Excel refers to the process of estimating unknown values that lie between known data points. This technique is particularly useful when you have a series of data points but need to determine values at points that fall between those data points. Excel provides several methods for interpolation, including linear interpolation, which assumes a constant rate of change between data points.
To perform linear interpolation in Excel, you can use built-in functions such as LINEST, TREND, or FORECAST. These functions allow you to create a linear trendline based on existing data points, enabling you to estimate values for intermediate points along the trendline.
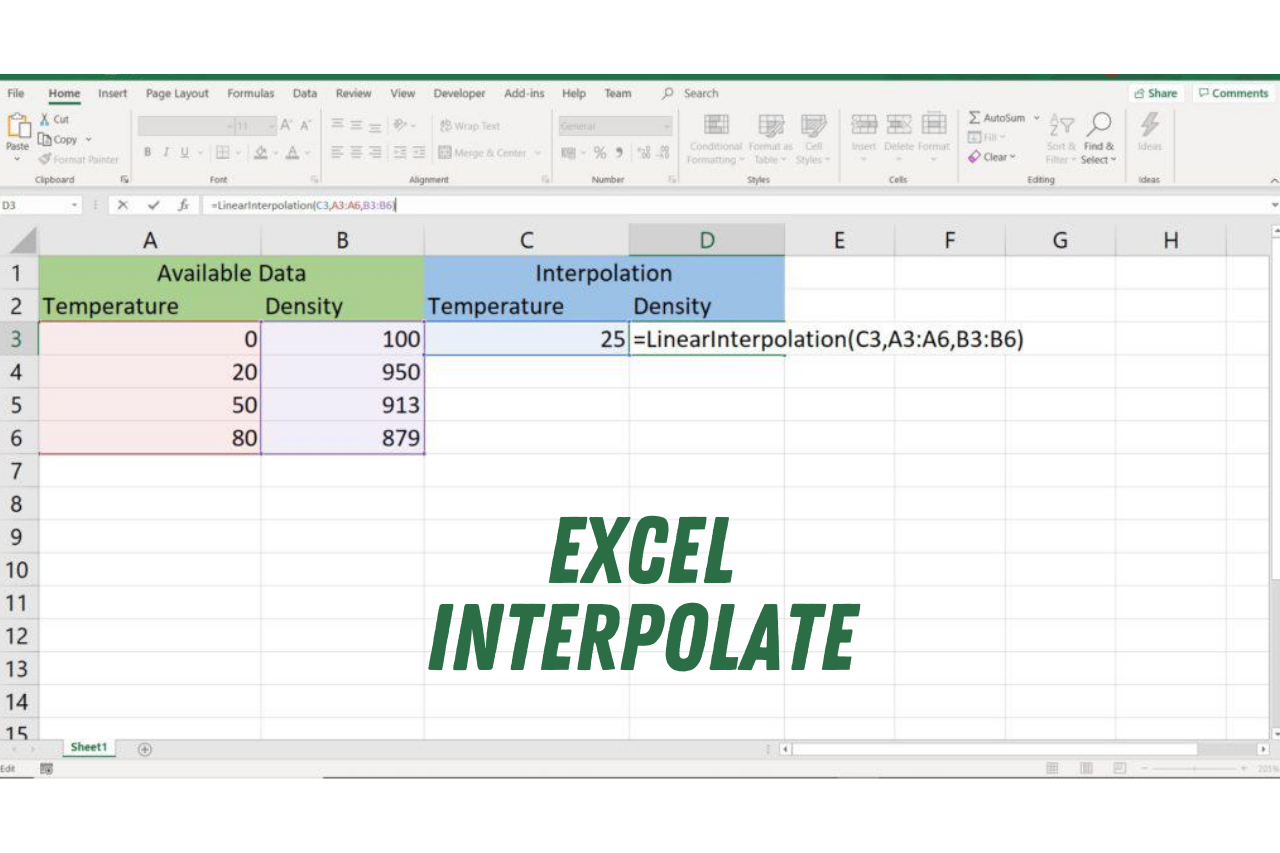
For example, suppose you have a dataset with known x and y values representing a series of data points. You can use Excel’s linear interpolation functions to predict the y-value corresponding to a specific x-value that falls between two known data points.
Interpolation in Excel can be a valuable tool for various applications, including forecasting future values based on historical data, estimating missing data points in a dataset, or creating smooth curves for graphical representation. However, it’s essential to understand the assumptions and limitations of interpolation methods and ensure that they are appropriate for your specific data and analysis objectives.
Table of Contents
- Introduction to excel interpolate
- How Interpolation Works
- Types of Interpolation
- 3.1 Linear Interpolation
- 3.2 Polynomial Interpolation
- 3.3 Cubic Spline Interpolation
- Excel Interpolation Functions
- 4.1 LINEST Function
- 4.2 FORECAST Function
- 4.3 TREND Function
- Step-by-Step Guide to Interpolating Data in Excel
- Common Applications of excel interpolate
- Advantages and Limitations
- Best Practices for Excel Interpolation
- Conclusion
- FAQs about Excel Interpolation
1. Introduction to Excel Interpolation
Excel interpolation is the process of estimating unknown values that lie between two known data points based on the relationship between those points. It is commonly used in fields such as finance, engineering, and statistics to fill in missing data or make predictions.
2. How Interpolation Works
Interpolation in excel interpolate works by fitting a mathematical function to the known data points and using that function to predict intermediate values. The accuracy of the interpolation depends on the method used and the assumptions made about the data.
3. Types of Interpolation
3.1 Linear Interpolation
Linear interpolation assumes a linear relationship between data points and estimates intermediate values by drawing a straight line between the two nearest points.
3.2 Polynomial Interpolation
Polynomial interpolation fits a polynomial function to the data points and uses it to estimate intermediate values. It offers greater flexibility but may lead to overfitting with high-degree polynomials.
3.3 Cubic Spline Interpolation
Cubic spline interpolation divides the data into intervals and fits a cubic polynomial to each interval. It provides smooth and continuous estimates but requires more computational resources.
4. Excel Interpolation Functions
4.1 LINEST Function
The LINEST function in excel interpolate calculates the parameters of a linear regression model, which can be used for linear interpolation.
4.2 FORECAST Function
The FORECAST function predicts a future value based on existing data points using linear regression.
4.3 TREND Function
The TREND function predicts future values based on existing data points using polynomial regression.
5. Step-by-Step Guide to Interpolating Data in Excel
- Enter your known data points into an excel interpolate worksheet.
- Pick a fitting introduction strategy in light of the idea of your information.
- Use the corresponding excel interpolate function to perform the interpolation.
- Verify the results and adjust as necessary.
6. Common Applications of Excel Interpolation
- Anticipating future stock costs given verifiable information
- Estimating missing values in a time series dataset
- Interpolating elevation data for geographic mapping
7. Advantages and Limitations
Advantages
- Provides a quick and easy way to estimate intermediate values
- Can be applied to various types of data with different interpolation methods
Limitations
- Assumes a certain degree of continuity and smoothness in the data
- May produce inaccurate results if the underlying data is noisy or irregular
8. Best Practices for Excel Interpolation
- Choose the interpolation method that best fits your data and objectives.
- Validate the results by comparing them to known data points or using alternative methods.
- Be mindful of the limitations and assumptions of interpolation and adjust your analysis accordingly.
9. Conclusion
Excel interpolation is a valuable tool for data analysis, allowing you to estimate intermediate values and make predictions based on existing data points. By understanding the principles of interpolation and applying them judiciously, you can enhance the accuracy and reliability of your analytical models.
10. FAQs about Excel Interpolation
- Is Excel interpolation accurate for all types of data?
- Excel interpolation can be accurate for well-behaved and continuous data, but it may produce unreliable results for noisy or irregular datasets.
- Can Excel handle large datasets for interpolation?
- Yes, Excel can handle large datasets, but performance may vary depending on the complexity of the interpolation method and the computational resources available.
- What should I do if excel interpolate produces unexpected results?
- If excel interpolate produces unexpected results, double-check your data and assumptions, and consider using alternative interpolation methods or software tools.
- Are there any limitations to excel interpolate functions?
- While excel interpolate functions are versatile, they may have limitations in handling certain types of data or producing accurate estimates in complex scenarios.
- Can I use Excel interpolation for time series forecasting?
- Yes, Excel interpolation functions such as FORECAST and TREND can be used for time series forecasting by extrapolating future values based on historical data.